🚀 Apex Log Analyzer
Apex Log Analyzer for VS Code lets Salesforce developers debug Apex logs instantly with flame charts, call trees, and SOQL/DML insights - find bottlenecks fast
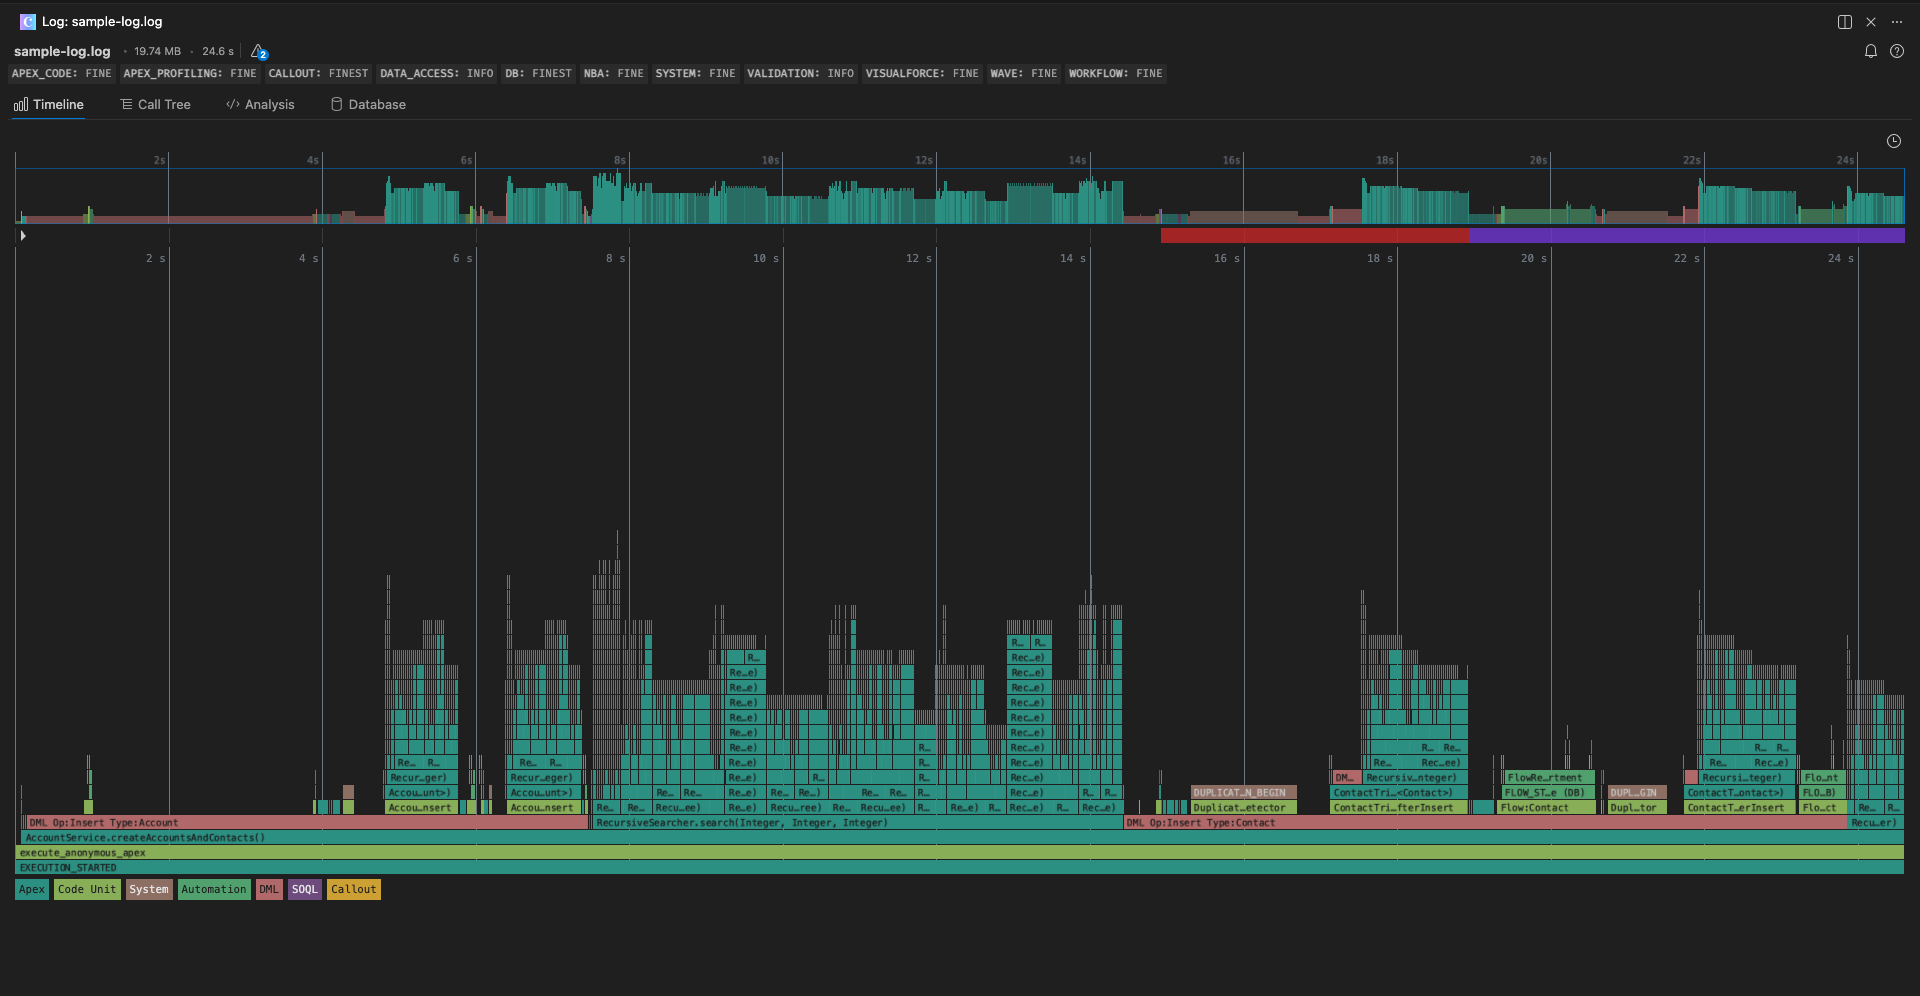
Flame Chart Visualization
See method timings in a modern flame chart. Instantly spot Apex transaction bottlenecks.
Fast Log Parsing
Processes massive Apex debug logs fast using a high-performance parser - no lag, no waiting.
Governor Limit Tracking
Stay under limits with a clear, interactive view of SOQL, DML, time and more.
Event Filtering
Hide noise. Focus only on what you care about - from method calls to debug statements and limits.
Turn 200,000+ Lines of Logs into Actionable Insights
Raw log files are hard to scan, and easy to misread. The Apex Log Analyzer renders a high-resolution flame chart that maps out every method call, time taken, and nested operations.
- 🌈 Color-coded log events
- 🔎 Zoom & pan into areas of interest
- ⏱ Time-based scaling to pinpoint slowdowns