🧠 Analysis
Analyze Salesforce debug logs with detailed metrics on method calls, including Self Time, Total Time, Count, Name, and Type. Easily sort, filter, and group log events by namespace or type, and export or copy results for efficient troubleshooting and performance optimization. The Analysis table uses a bottom-up caller grouping model, where each method is shown as a root with its direct callers as children.
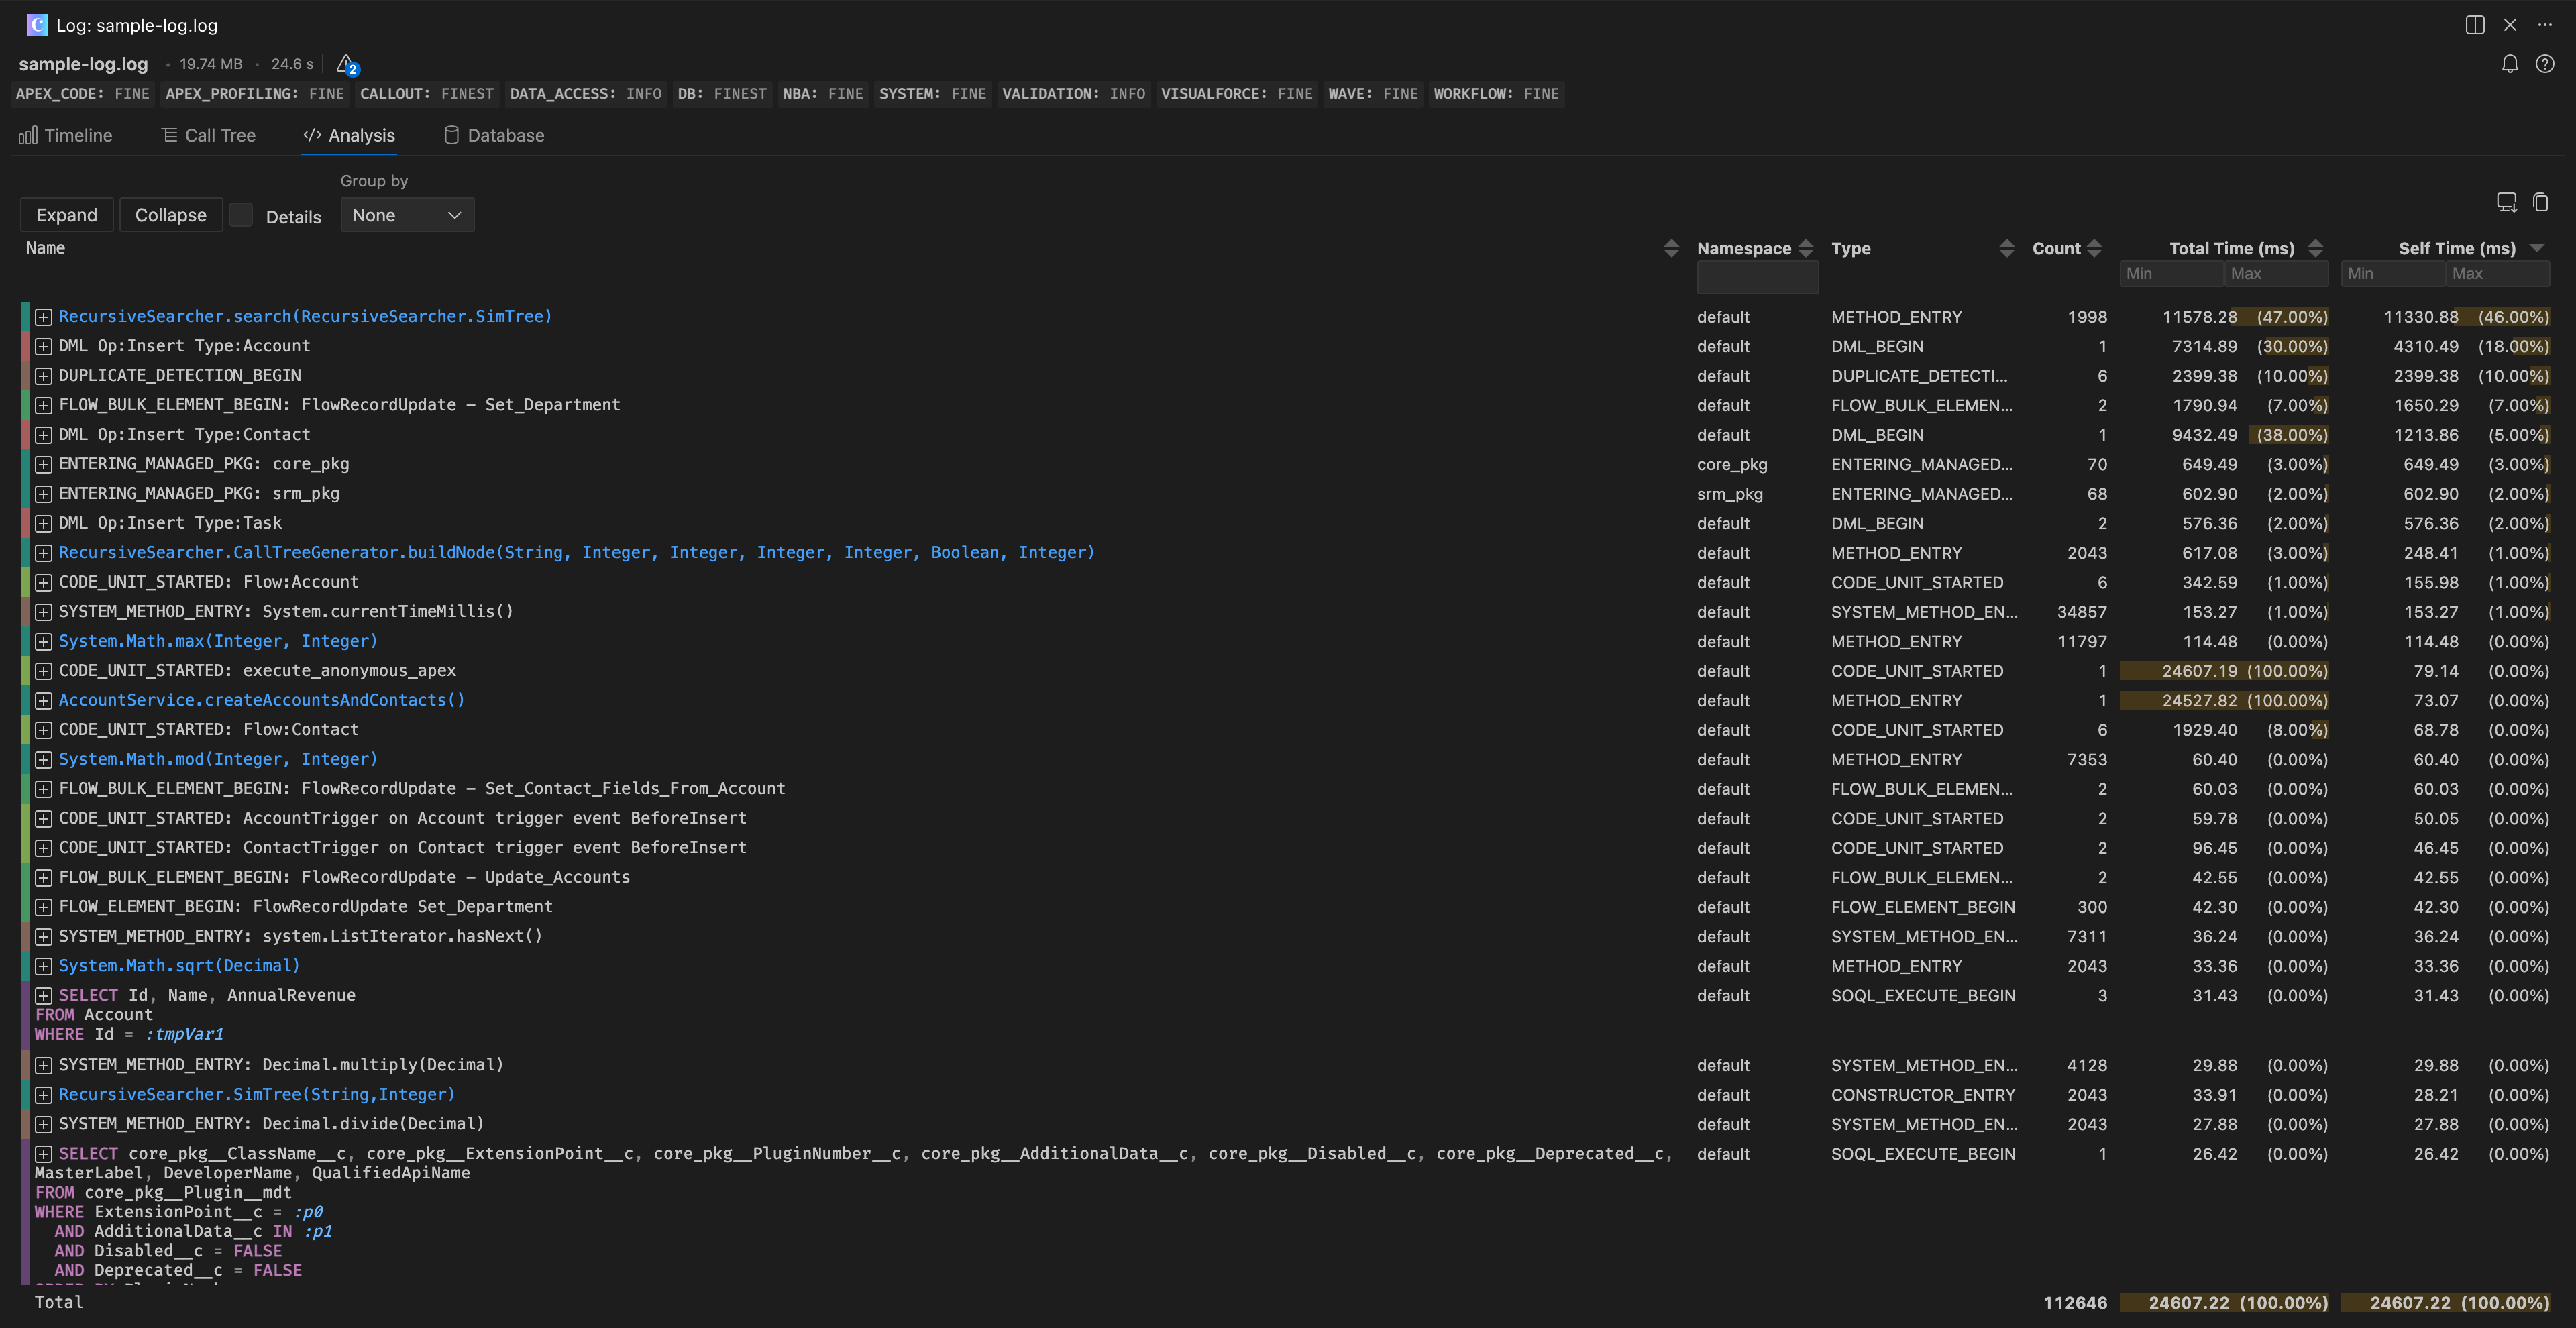
Sort
By default the Analysis table is sorted with the events that took the longest by Self Time at the top.
Each column can be sorted by clicking the column header, this will sort the rows ascending or descending.
Filtering
- Show Log events for specific namespaces using the namespace column filter
Group
The rows can be grouped by Type, Namespace, or Caller Namespace.
In this model, roots are callees and parent/child relationships represent callers expanded beneath each callee.
Total Time is the full attributed time for that callee path, while Self Time is the exclusive attributed time for the callee itself.
- Namespace: Shows the rows aggregated by their namespace e.g
default,MyNamespace - Caller Namespace: Shows the rows aggregated by the namespace of the direct caller (the immediate parent code unit). Useful for seeing which package triggered work in another package.
- Type: Shows the rows aggregated by namespace event type e.g
METHOD_ENTRY,DML_ENTRY
Export to CSV + copy to clipboard
Use Export to CSV above the table to save the table content to a file or Copy to Clipboard.
You can also focus the Analysis tables and use CMD / CTRL + c to copy the table content to clipboard. This can then be pasted into a spreadsheet or other file.