🌳 Call Tree
The Call Tree helps efficently visualize and navigate the call stack in Salesfroce Apex debug logs. Learn to expand and collapse method calls, sort and filter by execution metrics, and quickly jump to code locations in Visual Studio Code. Enhance your Salesforce debugging and performance analysis with detailed insights into DML, SOQL, and execution times.
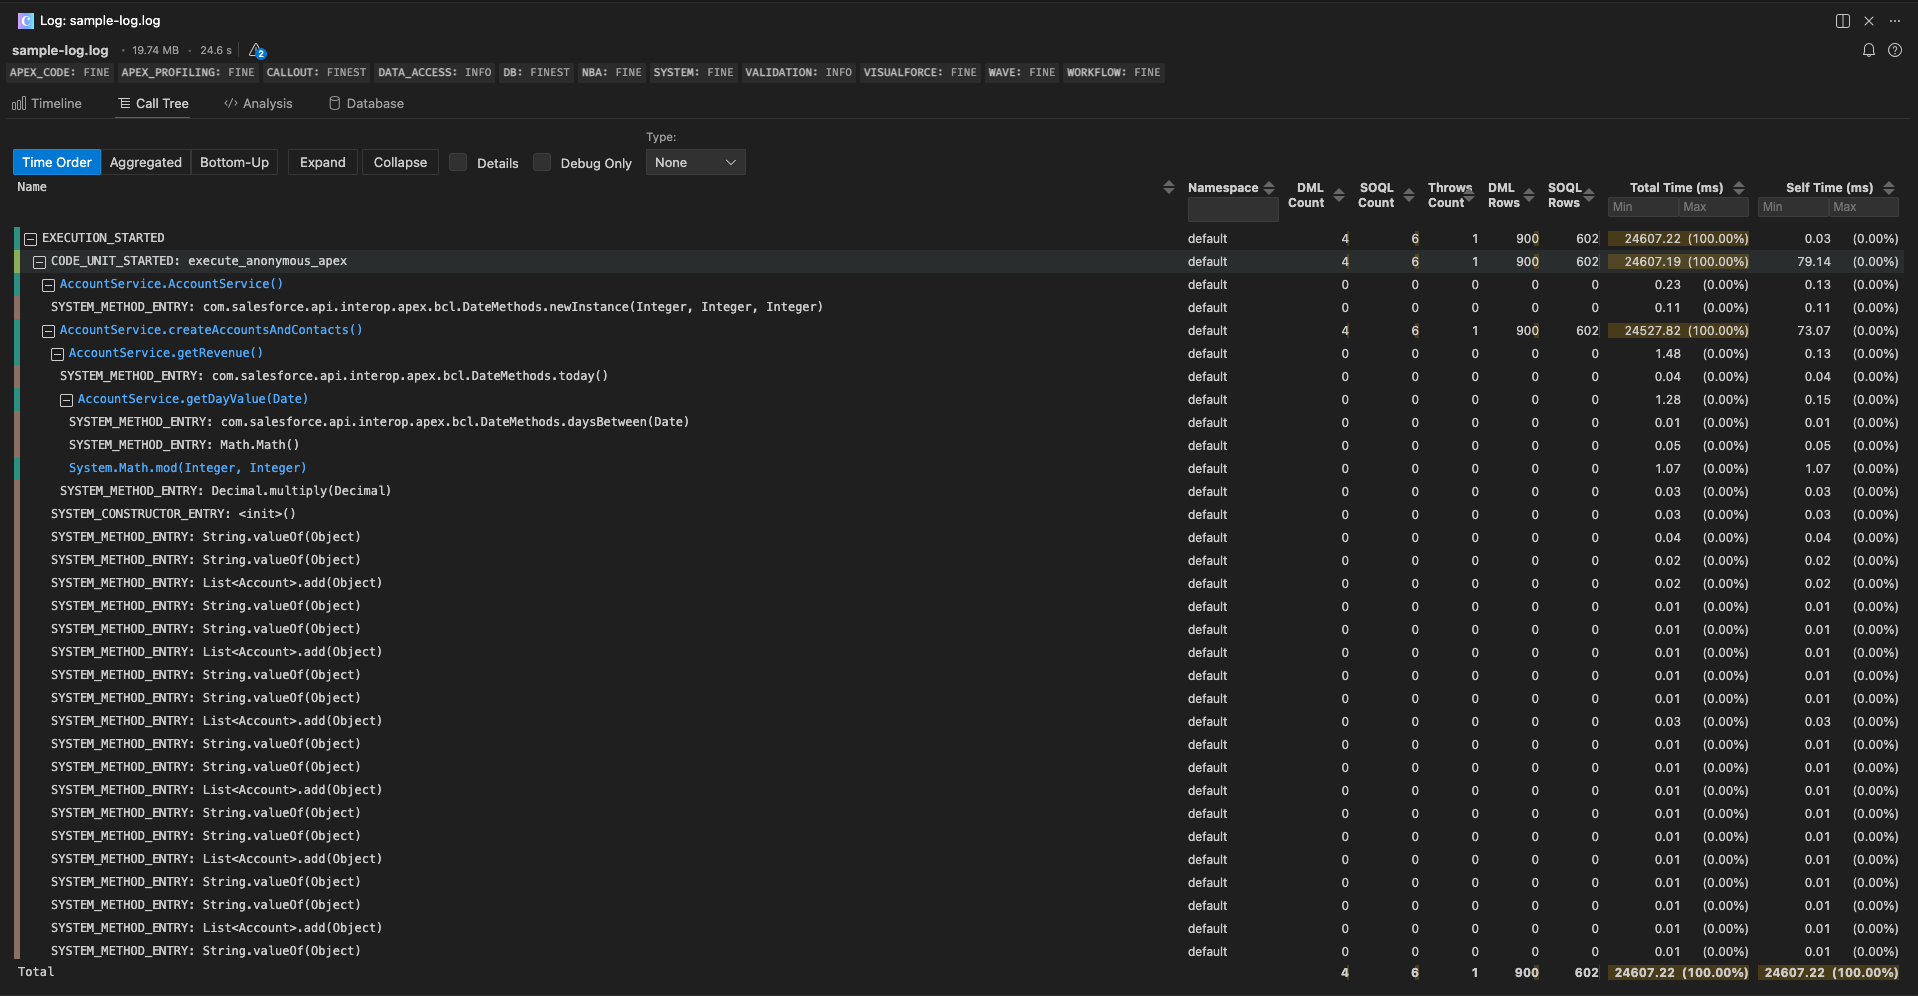
Each row shows event type, details such as method signature, self and total time as well as aggregated DML, SOQL, Throws and Row counts.
View Modes
The Call Tree supports three separate views, toggled via the toolbar:
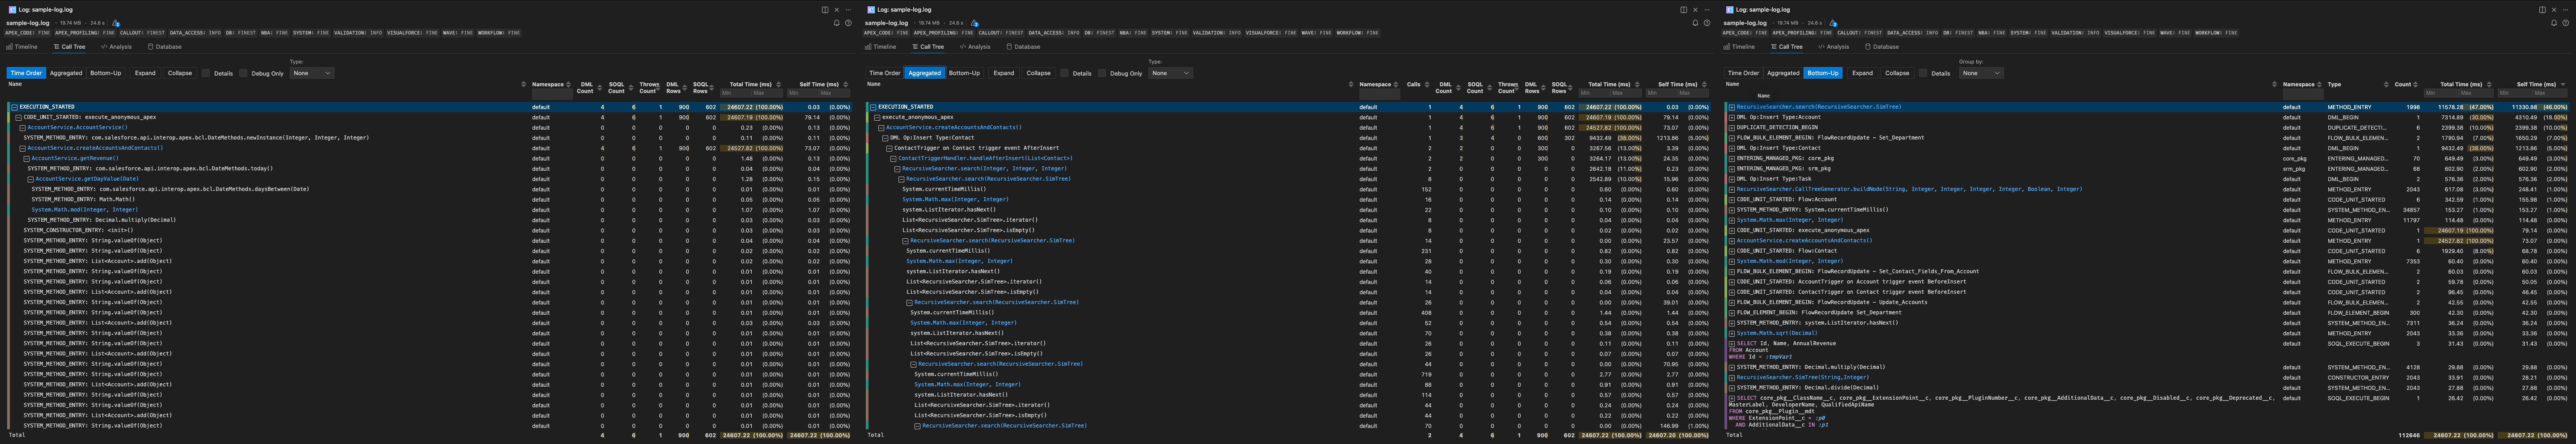
- Time Order (default) Displays the call stack in chronological execution order. Best when you want to follow the exact sequence of events from top to bottom.
- Aggregated Groups repeated method paths so repeated executions are combined. Best when you want a condensed hotspot view without reviewing every individual frame occurrence.
- Bottom-Up Starts with each callee as the root and expands into callers. In this view, roots are callees and expanded rows are caller context. Best when you want to find which methods are hogging the most time and see the different caller paths that led to them.
Go to Code
Clicking the link in the event column will open the corresponding file and line, if that file exists in the current workspace.
Sort
Each column can be sorted by clicking the column header, this will sort the rows within the tree structure e.g sorting by self time will sort the children within a parent with the largest self time to the top but only within that parent.
Filtering
- Details (events with 0 time) are hidden by default but can be shown/ hidden.
- Show only debug statements using the Debug Only filter.
- Show Log events for specific namespaces using the namespace column filter
- Min and Max filtering can be done on the Total Time and Self Time columns.
Debug Only and Type filtering are available in Time Order and Aggregated. The Details filter is available in all three views. The Bottom-Up view has its own grouping controls (None, Namespace, Caller Namespace, Type).
SOQL Formatting
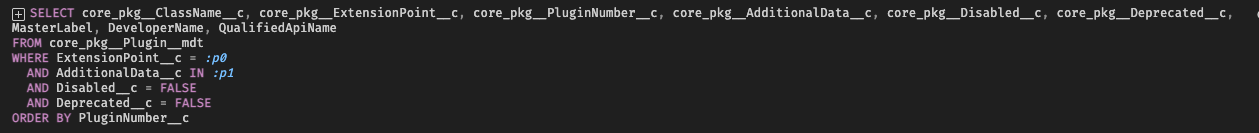
SOQL and SOSL query rows are reformatted onto multiple lines and syntax highlighted, so keywords, fields and bind variables are easy to read at a glance.
Keyboard Navigation
The Call Tree can be navigated with the keyboard. The up and down keys will move between rows, the left and right keys will expand and collapse a parent within the tree.
Category Coloring
The Name column is colored by each event's category — Apex, Code Unit, System, Automation, DML, SOQL, Callout and Validation — using the colors of the active timeline theme, so the Call Tree and the Timeline themes stay visually consistent.
By default a small color chip is shown against each row. To color the full cell instead (background tint and colored text), enable Settings → Apex Log Analyzer → Colorize Call Tree category names.
Colors follow the active timeline theme and update instantly when you switch themes via Log: Timeline Theme.