💾 Database
Database insights help Salesforce developers analyze DML, SOQL and SOSL operations, assess query selectivity, performance, and aggregations, and optimize Apex code using advanced sorting, grouping, filtering, call stack tracing, and CSV export tools.
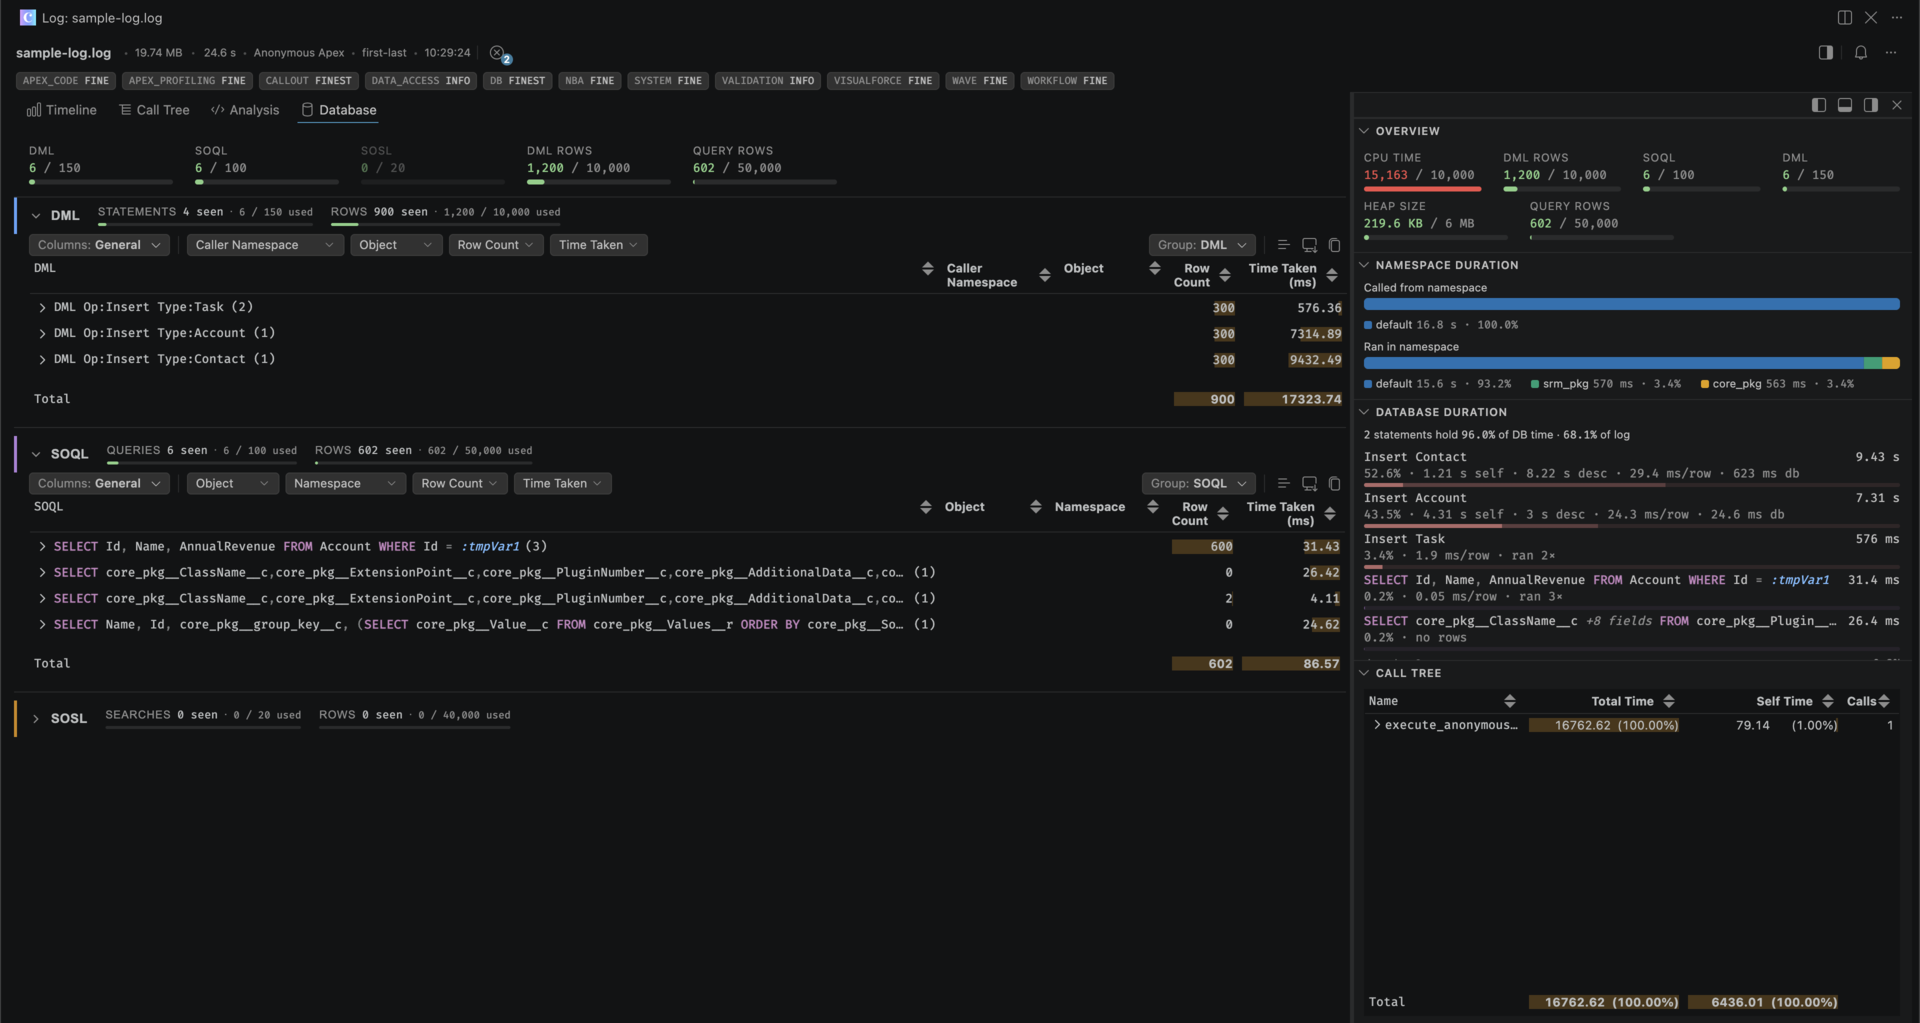
The tab has separate DML, SOQL and SOSL sections
Governor limits
- Overview strip - SOQL, SOSL, DML and query/DML rows as
used / limit, coloured as they near the limit. - Tracked vs consumed - per section, statements seen in the log vs the number Salesforce counted (
CUMULATIVE_LIMIT_USAGE). A gap is usually custom metadata (__mdt), which is free unless the query selects a long text area field or runs in a Flow. - SOSL rows - metered per query against the 2,000-rows-per-query cap.
Consumed figures need the Apex Profiling log category. Without it, sections show the tracked count and mark the limit n/a.
The Selectivity column will have a green tick if the query is selective, a red cross if it is not and will be blank if the selectivity could not be determine. Sorting on this column will sort the rows by relative query cost, this number can be seen by hovering the cell on the selectivity column.
Sort
The rows can be sorted ascending or descending by DML/SOQL, Row Count and Time Taken and by Selectivity and Aggregations on the SOQL table. By default the rows within each group are sorted descending with the rows that have the highest row count at the top. Row within each group can be sorted by clicking the column header, this will sort the rows ascending or descending.
If the grouping is removed the sorting applies the same but across all rows instead of within each group.
Filtering
- Namespace, Object or Caller Namespace - pick one or more values to keep.
- Row Count and Time Taken - set a min-max range.
Column Views
Switch column sets from the Columns button in the toolbar (or the header right-click menu). SOQL offers General (incl. the Object column), Performance, Query Plan (Relative Cost, Leading Operation, SObject Type, Cardinality) and Limits; DML offers General, Timing and Limits; SOSL offers General and Timing. Show or hide individual columns there; an edited view shows a reset icon. Choices persist per table.
Group
By default rows are grouped by the SOQL/ DML text, grouping can be removed and the rows shows as a flat list using the Group by dropdown. The groups are default sorted with the groups with the most items at the top.
SOQL and DML can be grouped by Object (the queried/target SObject), Namespace, or Caller Namespace, as well as the statement text. SOSL can be grouped by Namespace or Caller Namespace.
Caller Namespace is the namespace of the direct caller that issued the statement, handy for seeing which package's code is responsible, even when the time is attributed to the default namespace.
Inspect a statement
Selecting a SOQL, DML or SOSL row opens the inspector, which shows that statement's vitals and governor metrics, the call stack that led to it, a call tree scoped to it, and - for SOQL - its optimization tips.
Show in Call Tree
Right-click any statement and choose Show in Call Tree to jump to it in the full Call Tree, with the row expanded, scrolled to and focused. Useful when you want the surrounding execution rather than the statement alone.
Export to CSV + copy to clipboard
Use Export to CSV above the table to save the table content to a file or Copy to Clipboard.
You can also focus the DML/ SOQL tables and use CMD / CTRL + c to copy the table content to clipboard. This can then be pasted into a spreadsheet or other file.