🧭 Inspector
Select anything - a Timeline frame, a Call Tree or Analysis row, a SOQL/DML/SOSL statement - and the inspector shows it in depth without you leaving the tab you're working in.
It docks to the right, left or bottom, resizes by dragging its edge, and is toggled from the button in the header. It opens on your first selection, then stays however you left it, including the next time you open a log. See Settings.
Sections
- Details - timing, plus every governor metric the selection consumed as
used / limit. For SOQL also selectivity, query plan and cardinality, with the query text highlighted and copyable. - Variables - what Apex could reach from the frame: its Local variables,
thisand its fields, and the Static variables assigned by that point, grouped by class. Every value reads as it stood at the frame, and a name the log declared but never wrote readsnot assigned. An object opens into the fields the log recorded for it, wherever they were set, and a field that is itself an object opens again. Every row that opens previews what is inside it with a count beside it, and the hover says whether those parts were written on one line or assembled from writes of their own. An object the log recorded nothing for reads{}with nothing to open. Where the log wrote an address instead of a value, the object at that address is shown, orno value recordedwhere the log never wrote one. A statement owns no variables of its own, so it answers from the Apex frame that ran it. Pick a row that merges calls - Aggregated, Bottom-Up or any Analysis row - and the section compares those calls instead: the names that varied lead, each opening into every value it held, how many calls held it, and whether that was one unbroken run of calls or a value that came and went. A name every call agreed on reads as it does for one frame. Hover a value to light the calls that held it in the timeline and the grids, and click to keep them lit. An object opens into its fields as it does for one frame, read as the first call that held it recorded it. Statics are left out: a static lives for the whole transaction, so it moves for reasons the row does not own. Needs the log captured with Apex Code at FINEST. - Self time by namespace - Timeline only: the self time under the selection split by the namespace whose code ran it, so you can see whose package burned it. Every namespace bar colours the six biggest and gathers the rest into one others segment, which names them on hover.
- Findings - Analysis only: which of the log's findings name the selected method or anything it called, so you can tell whether the row you picked is one of the log's problems.
- Call stack - the parent frames that led to the selection, outermost first, with total and self time.
- Call tree - Time Order and Aggregated run from the log root through the selection's callers into what ran inside it; Bottom-Up ranks what ran inside it by self time. A caller holds only the time that reached the selection, so the tree reads 100% down to it and everything below is a share of it.
- SOQL issues - SOQL only: optimization tips for the query.
Collapse a section by clicking its header. Drag a header to reorder the stack, or press Alt+Up / Alt+Down on it. Right-click a header to choose which sections show, or to reset the list. Each list keeps its own choices - every tab, and Detail apart from Summary - because one section answers a different question in each.
Sections that read the whole log size themselves to their content, and to no more than an equal share of the panel - they grow back towards their content only as far as the other sections leave room, and scroll inside past that, so no one section can crowd the rest down to its minimum. The ones that answer about a selection do not: Details and Self time by namespace keep a steady height, and Variables, Call stack, Call tree and Findings share what is left. Every one of those is a share of the panel, so docking wider or taller gives each section more room. So stepping from one frame to the next never resizes the stack - a section with more to say scrolls inside instead.
Drag a divider to resize: the sections on the other side give up room in turn, each down to the same small minimum, and the divider follows the pointer until they are all there. A drag sets the size of every section, so the stack holds where you left it. Double-click a divider to hand back the sizes of the two sections beside it, or use Reset Sections for the whole stack. Sizes are not remembered: a size set for one log is the wrong one for the next.
Summary
Press Summary in the panel's header to read the whole log without giving up your selection, and Detail to go back to it. The switch appears as soon as something is selected, and any new selection returns the panel to it.
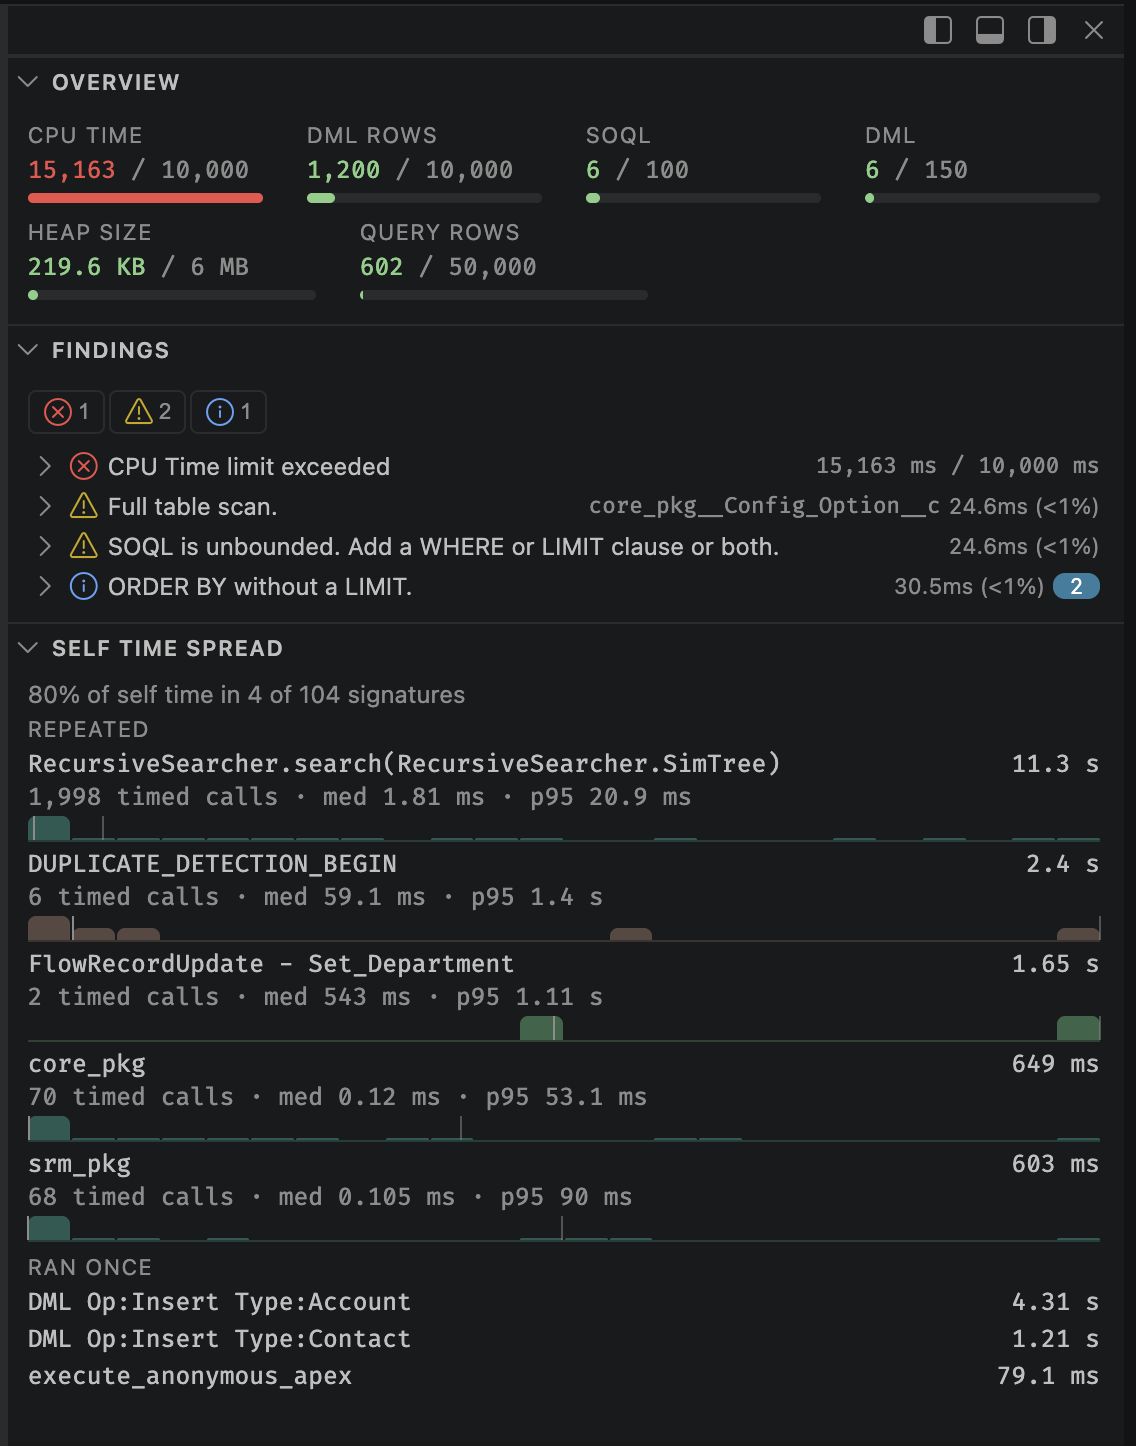
With nothing selected the inspector reads the whole log. Every tab opens with an Overview - the six governor metrics closest to their limit - then adds what its own tab can answer at log scope:
- Timeline - time by category, self time by namespace, governor usage over time, and the whole-log call tree, which opens on the frames holding the most self time. Click a point on a usage chart, or step the arrow keys across a focused chart and press
Enter, to move the Timeline to that instant and zoom in on it. Nothing is selected, so the inspector keeps this whole-log reading. - Call Tree - the hot path the log spent its time in, and the hot spots with the most self time.
- Database - Namespace duration: Called from namespace - the namespace that issued the statement - and, when they differ, Ran in namespace, the namespaces of whatever ran beneath it, such as a package trigger firing on your DML. Database duration: how few statements hold the time, with cost per row, how often each ran, and its duration split into self time and descendants, so a DML that is cheap in itself but fires seven seconds of triggers reads as one. Call tree: every call path that ends in a query, DML or search, with Total Time - the database time at or below the row - beside Self Time, the row's own code. A row with all total and no self is waiting on the database; the reverse is the Apex around it.
- Analysis - Findings: what is slow or wrong in the log, and what to do about it, led by the findings by severity - press any number of them to hold the list to those. A finding whose events the log times also shows how long they took and what that is of the log. Each finding lists the statements behind it, most repeated first; click one to reveal its row in the grid. Self time spread: how few signatures hold 80% of the log’s self time, then a histogram of per-call self time for each of the busiest repeated signatures, with the median and the 95th call marked. The grid gives an average, which reads the same whether every call is slow or one call is; the shape tells them apart. Move the pointer across a lane to read how many calls a bucket holds. A call the log made once has no shape, so the costliest of them are named under Ran once. Only calls the log timed count. Click any row to select its worst call.
Every figure comes from the log itself, so a truncated log, a log without Rows: or one without CUMULATIVE_LIMIT_USAGE reports less rather than guessing, and says so. Ranked sections list only the top few and account for the rest in a final row. Select a row and every section re-scopes to it.
Row actions
Right-click a row in the Call stack or Call tree for:
| Action | Result |
|---|---|
| Show in Call Tree | Jumps to that frame in the full Call Tree tab |
| Copy Name | The frame's name |
| Copy Details | Name, type, duration and governor metrics |
| Copy Call Stack | The whole parent chain, one frame per line |
Press Escape to clear the selection on the tab you're on; the inspector returns to its whole-log view.
Clicking a row highlights the matching frame or row in the tab you're on, and never switches tab: the Timeline selects the frame and centers it when it's off screen, the Call Tree scrolls to it in every view, and the Database tab selects the statement. Rows in the Call tree's Aggregated and Bottom-Up views merge several occurrences, so clicking one marks every occurrence, goes to the first, and reads the details of the calls it counts. Focus stays in the inspector, so the arrow keys keep moving there. Arrow keys move between rows, and CMD / CTRL + c copies the table.
Hovering works both ways and moves nothing - no selection, no scroll, no pan:
- Hover an inspector row to pick out what it names in the tab you're on: the Timeline dims around the frame, and the Call Tree, Analysis and Database tables mark the row. A row that merges several occurrences marks all of them.
- Hover a frame, row or statement in the tab you're on to mark the inspector rows that name it, where they are already on screen. Analysis rows are method totals rather than single calls, so they mark nothing.
What you clicked stays picked out as the pointer moves away, so you can read the Timeline or a table with it still marked. Escape clears it.