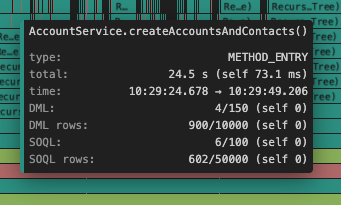
🔥 Timeline / Flame Chart
Use the Timeline to visualize code execution, event durations, and performance bottlenecks. Zoom, pan, navigate with the minimap overview, and interact with detailed tooltips for efficient Salesforce apex log analysis and debugging.
The new experimental timeline is up to 7X faster than the legacy timeline, with improved performance especially for large logs. It includes text labels on frames, faster zoom/pan operations, and a more natural time axis scaling.
To revert to the legacy timeline, navigate to Settings → Apex Log Analyzer → Timeline → Legacy and enable it.
Navigation
Zoom + Pan
| Action | Mouse | Keyboard |
|---|---|---|
| Zoom In/Out | Scroll wheel (mouse-anchored) | W / S or + / - |
| Pan Horizontally | Alt/Option + Scroll, Trackpad swipe, or Drag | A / D |
| Pan Vertically | Shift + Scroll or Drag | Shift+W / Shift+S |
| Reset Zoom | — | Home or 0 |
- When zooming, the mouse pointer position is kept on screen (mouse-anchored zoom).
- Trackpad users can swipe left/right for natural horizontal panning.
- Time markers are shown with a ms time value (e.g., 9600.001 ms).
Frame Selection
Click on any event to select and highlight it. Selection enables keyboard navigation through the call stack.
| Action | Mouse | Keyboard |
|---|---|---|
| Select Frame | Click | — |
| Clear Selection | Click empty space | Escape |
| Navigate to Parent | — | Arrow Down |
| Navigate to Child | — | Arrow Up |
| Navigate to Sibling | — | Arrow Left / Arrow Right |
| Focus/Zoom to Frame | Double-click | Enter or Z |
When no frame is selected, arrow keys pan the viewport. When a frame is selected, arrow keys navigate the call stack. Hold Shift to always pan.
Go to Call Tree
| Action | Mouse | Keyboard |
|---|---|---|
| Show in Call Tree | Cmd/Ctrl + Click | J |
| Show Context Menu | Right-click | — |
Use J or Cmd/Ctrl+Click to navigate to the selected frame in the Call Tree. Right-click opens a context menu with additional actions.
Context Menu
Right-click on any frame to access:
- Show in Call Tree (
J) — Navigate to the frame in the Call Tree - Go to Source — Jump to the source method in your project (when available)
- Zoom to Frame (
Z) — Zoom and center the selected frame - Copy Name (
Cmd/Ctrl+C) — Copy the frame name to clipboard - Copy Details — Copy tooltip information
- Copy Call Stack — Copy the full call stack
Right-click on empty space shows Reset Zoom (0).
Markers
Log issue markers (truncation, errors, etc.) can be selected and navigated:
| Action | Mouse | Keyboard |
|---|---|---|
| Select Marker | Click | — |
| Navigate Markers | — | Arrow Left / Arrow Right (when marker selected) |
| Jump to Call Tree | Cmd/Ctrl + Click | J |
Search + Highlight
The timeline supports search functionality that dims non-matching events, making it easier to find specific matches visually.
| Action | Keyboard |
|---|---|
| Next Match | Enter |
| Previous Match | Shift+Enter |
| Continuous Navigation | Hold Enter or Shift+Enter |
Measurement & Zoom Tools
Measure Range
Use Shift+Drag to measure the duration between any two points on the timeline. This is useful for precisely measuring the time span of specific operations or groups of events.
| Action | Mouse/Keyboard |
|---|---|
| Create Measurement | Shift+Drag on timeline |
| Resize Measurement | Drag the left or right edge of the measurement |
| Zoom to Measurement | Double-click inside measurement, or click zoom icon |
| Clear Measurement | Escape or click outside the measurement area |
The measurement overlay displays:
- The time duration of the selected range
- A zoom icon to quickly zoom to fit the measured area
Hover near the edges of an existing measurement to see the resize cursor. Drag to adjust the measurement boundaries — edges can be dragged past each other to swap positions.
Area Zoom
Use Alt/Option+Drag to select a time range and instantly zoom to fit it. This provides a quick way to focus on a specific portion of the timeline.
| Action | Mouse/Keyboard |
|---|---|
| Area Zoom | Alt/Option+Drag on timeline |
Release the mouse button to zoom the viewport to fit the selected area exactly.
Tooltip
Hovering over an element displays detailed information about that event. Use J or Cmd/Ctrl+Click to navigate to the frame in the Call Tree.
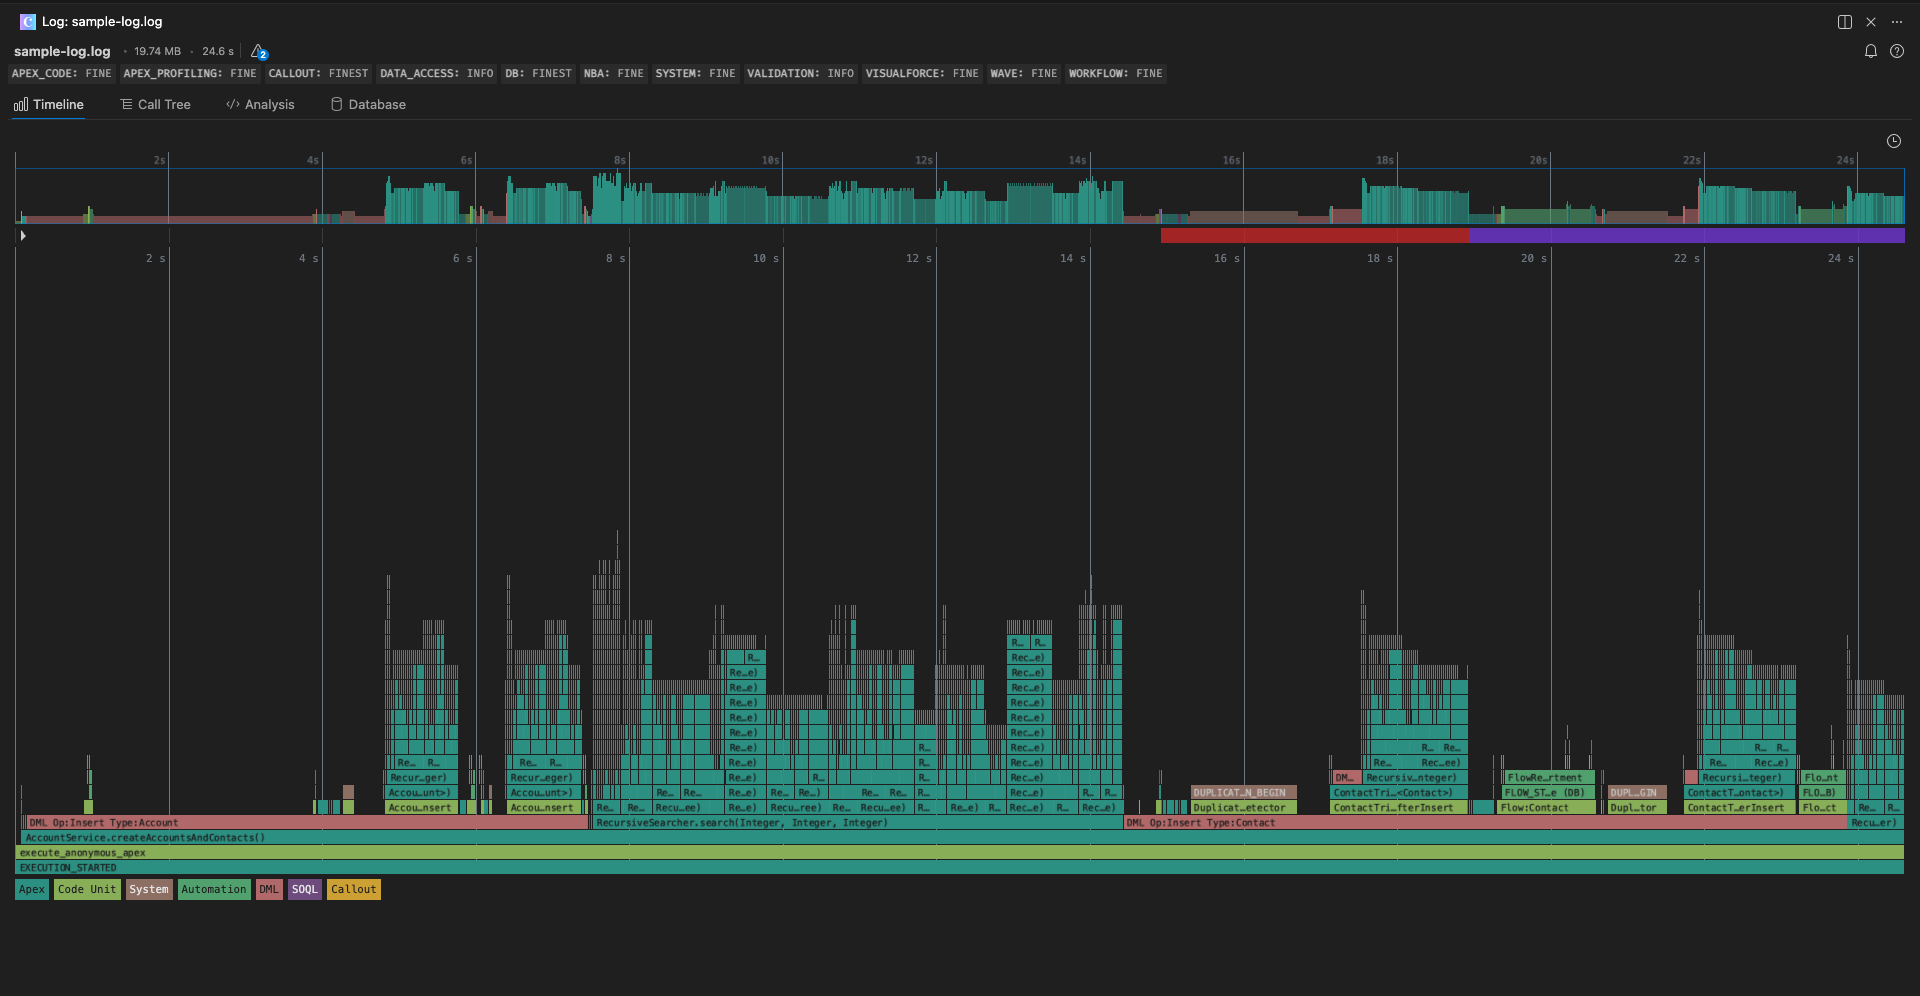
The tooltip provides the following information:
- Event Name - e.g.,
METHOD_ENTRY,EXECUTION_STARTED,SOQL_EXECUTION_BEGIN - Event Description - Additional information about the event such as method name or SOQL query executed
- Timestamp - The start and end timestamp for the given event which can be cross-referenced in the log file
- Time - Wall-clock time of day for the event (e.g.,
14:30:05.122 → 14:30:06.625). Only shown when wall-clock data is available in the log. - Duration - Made up of Total Time (time spent in that event and its children) and Self Time (time directly spent in that event)
- Rows - Shows Total Rows (rows from that event and its children) and Self Rows (rows directly from that event)
Minimap
The minimap gives you instant context of your entire log. Spot hotspots at a glance, jump anywhere with a click, and always know exactly where you are—all without scrolling.
What the Minimap Shows
- Skyline Chart: A density-based visualization:
- Height = maximum call stack depth at that point
- Color = dominant event category (Apex, SOQL, DML, etc.)
- Opacity = event density (brighter = more events)
- Viewport Lens: A window showing exactly what's visible in the main timeline (time range horizontal, depth range vertical)
- Time Axis: Time reference markers at the top
- Markers: Error, skip, and truncation markers from the main timeline
- Cursor Mirroring: Hover to see a guide line on the main timeline
Mouse Interactions
| Action | Mouse | Result |
|---|---|---|
| Create Zoom | Drag anywhere | Draw a viewport area and zoom to it |
| Resize Viewport | Drag lens edge | Adjust zoom range |
| Move Viewport | Drag top/Shift+Drag | Pan the viewport |
| Teleport Lens | Cmd/Ctrl+Click | Center the lens on click position |
| Zoom In/Out | Scroll (vertical) | Zoom at cursor position |
| Pan Horizontally | Scroll (horizontal) | Move viewport left/right |
| Pan Depth | Drag (vertical) | Scroll the main timeline up/down |
| Reset | Double-click | Zoom out to fit entire timeline |
Cmd/Ctrl+Click is the fastest way to jump to any point in a massive log. The lens teleports to center on your click while preserving the current zoom level.
Keyboard Shortcuts
When your mouse is hovering over the minimap, these keyboard shortcuts are available:
| Key | Action |
|---|---|
Arrow Left | Pan viewport left (10% of selection width) |
Arrow Right | Pan viewport right (10% of selection width) |
Arrow Up | Pan depth up (show deeper frames) |
Arrow Down | Pan depth down (show shallower frames) |
W / + / = | Zoom in (narrow the lens) |
S / - | Zoom out (widen the lens) |
Home | Jump to timeline start |
End | Jump to timeline end |
0 / Escape | Reset zoom (fit entire timeline) |
Lens Label
When hovering over the viewport lens or dragging, a label appears showing:
- The duration of the selected time range (e.g., "1.23s")
- The time range start and end (e.g., "0.5s - 1.73s")
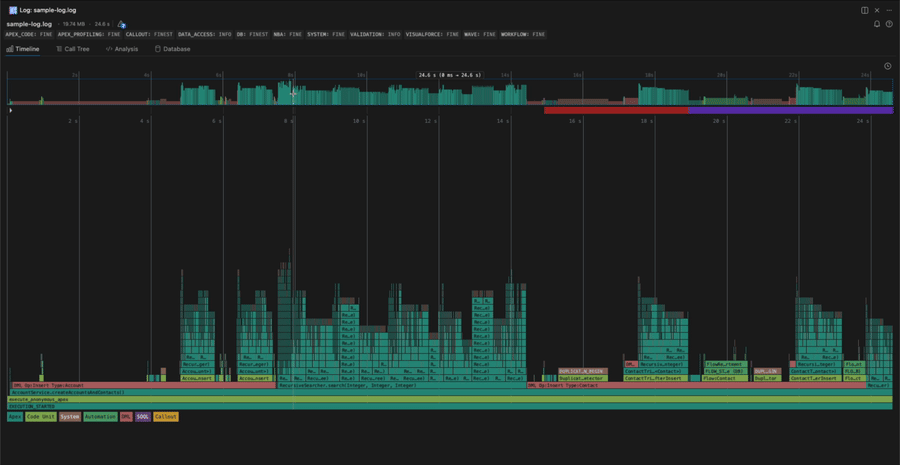
Governor Limits Strip
The Governor Limits strip displays Salesforce governor limit usage over time, positioned below the main timeline. It provides instant visual feedback on limit consumption to help identify potential limit breaches.
Display Modes
Collapsed Mode (Default)
A compact heat-style visualization showing the maximum limit usage across all metrics at each point in time.
Traffic Light Colors:
| Usage Range | Color | Meaning |
|---|---|---|
| 0-50% | Transparent | Safe |
| 50-80% | Amber/Orange | Warning |
| 80-100% | Red | Critical |
| >100% | Purple | Breach |
Expanded Mode
Click the chevron icon (◀/▼) in the top-left corner or Shift+Click anywhere to expand to a full step chart showing:
- Tier 1 Metrics: Top 3 metrics by usage (solid colored lines)
- Tier 2 Metrics: Any metric exceeding 80% (solid colored lines)
- Tier 3 Metrics: Remaining metrics (aggregated as grey dashed line)
- Danger Zone: Semi-transparent band from 80-100%
- 100% Limit Line: Red dashed line at the limit threshold
- Breach Areas: Purple shading for values above 100%
Mouse Interactions
| Action | Mouse | Result |
|---|---|---|
| Toggle View | Click chevron or Shift+Click | Switch between collapsed/expanded |
| Show Tooltip | Hover | Display metric breakdown |
| Center Timeline | Click on strip | Pan timeline to clicked position |
| Zoom | Scroll (vertical) | Zoom at cursor position |
| Pan | Scroll (horizontal) | Move timeline left/right |
| Reset View | Double-click | Fit entire timeline |
Keyboard Shortcuts
When your mouse is hovering over the Governor Limits strip, these keyboard shortcuts are available:
| Key | Action |
|---|---|
Arrow Left | Pan viewport left (10% of selection width) |
Arrow Right | Pan viewport right (10% of selection width) |
W / + | Zoom in |
S / - | Zoom out |
Home | Jump to timeline start |
End | Jump to timeline end |
0 / Escape | Reset zoom (fit entire timeline) |
Tooltip
Hovering over the metric strip displays a detailed breakdown showing:
- Always-visible metrics: CPU Time, Heap Size, SOQL Queries, Query Rows, DML Statements, DML Rows
- Top 3 by percentage: Highest usage metrics (if not already shown)
- Critical metrics: Any metric at or above 80%
- Summary: Count of remaining metrics with max percentage
Each row displays: color swatch, metric name, percentage, and used/limit values.
Wall-Clock Time
The timeline supports switching between two time display modes:
- Elapsed Time (default): Time relative to the start of the log (e.g.,
0 ms,1500 ms,2.5 s) - Wall-Clock Time: Actual time of day from the log (e.g.,
14:30:05.122)
Click the clock icon button in the top-right corner of the timeline toolbar to toggle between modes.
Themes
The timeline supports multiple color themes for better visual clarity and personalization. The extension includes 19 built-in themes with improved contrast and readability.
Built-in Themes
The following themes are available out of the box:
- 50 Shades of Green (default)
- 50 Shades of Green Bright
- Botanical Twilight
- Catppuccin
- Chrome
- Dracula
- Dusty Aurora
- Firefox
- Flame
- Forest Floor
- Garish
- Material
- Modern
- Monokai Pro
- Nord
- Nord Forest
- Okabe-Ito
- Salesforce
- Solarized
Switching Themes
There are two ways to change the active timeline theme:
Command Palette
- Open the Command Palette (
Cmd+Shift+Pon macOS orCtrl+Shift+Pon Windows/Linux) - Type "Log: Timeline Theme"
- Select a theme from the list
- Preview themes by navigating through the options with arrow keys
- Press
Enterto confirm, orEscto revert to the previous theme
Settings
Navigate to Settings → Apex Log Analyzer → Timeline → Active Theme and select your preferred theme from the dropdown.
Custom Themes
You can create custom color themes to match your preferences or specific use cases.
Creating Custom Themes
- Navigate to Settings → Apex Log Analyzer → Timeline → Custom Themes
- Define your custom theme(s) using the following structure:
"lana.timeline.customThemes": {
  "Glacial Warmth": {
    "apex": "#6882A6",
    "codeUnit": "#7A9B6E",
    "system": "#9E8E7C",
    "automation": "#D98650",
    "dml": "#C85A5A",
    "soql": "#57A89A",
    "callout": "#C9A64D",
    "validation": "#8B7BAC"
  },
  "Orchid Slate": {
    "apex": "#647C96",
    "codeUnit": "#8872A8",
    "system": "#8A7E7E",
    "automation": "#C08545",
    "dml": "#C94C6E",
    "soql": "#5A9E85",
    "callout": "#B5A044",
    "validation": "#4EA6A6"
  }
}
Theme Color Properties
Each theme requires the following color properties (in hex format):
- apex - Apex method entry/exit events
- codeUnit - Code Unit events
- system - System method calls
- automation - Workflow, Flow, and Process Builder events
- dml - DML operations (insert, update, delete, etc.)
- soql - SOQL queries
- callout - HTTP callout events
- validation - Validation rule events
Custom themes will appear in the theme selector alongside built-in themes and can be switched using the Command Palette or settings.
Custom theme names cannot override built-in theme names. If you use the same name as a built-in theme, the built-in theme will take precedence.