Settings
Timeline themes
The Timeline flame graph and the Call Tree Name column are colored by event category using the active theme. Configure themes from preferences -> extensions -> Apex Log Analyzer or in settings.json.
Select a theme
Use lana.timeline.activeTheme to pick one of the built-in themes - for example 50 Shades of Green, Catppuccin, Dracula, Nord, or Salesforce - or the name of a custom theme you have defined.
Or run Log: Timeline Theme from the Command Palette to switch theme without opening settings - the Timeline and Call Tree update instantly.
Custom themes
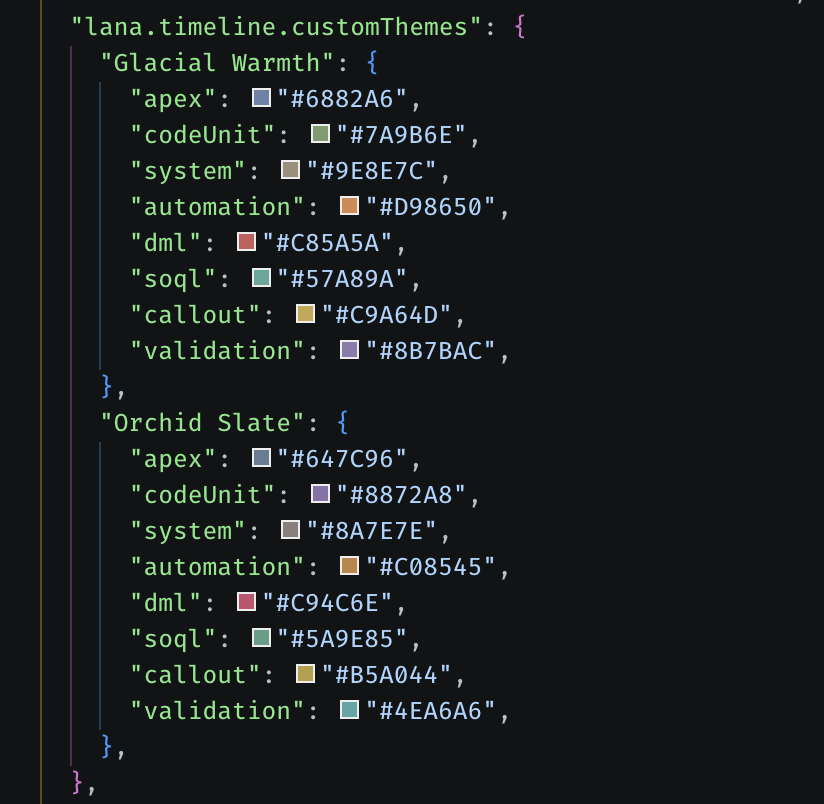
Define your own with lana.timeline.customThemes. Each key is a theme name and each value sets the eight category colors: apex, codeUnit, system, automation, dml, soql, callout and validation. Set lana.timeline.activeTheme to a custom theme's name to use it.
"lana.timeline.customThemes": {
  "Glacial Warmth": {
    "apex": "#6882A6",
    "codeUnit": "#7A9B6E",
    "system": "#9E8E7C",
    "automation": "#D98650",
    "dml": "#C85A5A",
    "soql": "#57A89A",
    "callout": "#C9A64D",
    "validation": "#8B7BAC"
  },
  "Orchid Slate": {
    "apex": "#647C96",
    "codeUnit": "#8872A8",
    "system": "#8A7E7E",
    "automation": "#C08545",
    "dml": "#C94C6E",
    "soql": "#5A9E85",
    "callout": "#B5A044",
    "validation": "#4EA6A6"
  }
}
Frame details on hover
lana.timeline.showTooltip (default true) shows a details panel when you hover or select a frame on the Timeline. The Timeline toolbar has a button for the same setting. Turn it off to read the chart without the panel; the inspector still shows the details of the selected frame.
Legacy timeline colors
lana.timeline.colors sets per-event-type colors and applies only to the legacy timeline (lana.timeline.legacy: true). Prefer themes above for the current timeline.
Call Tree category coloring
The Call Tree colors its Name column by event category using the active timeline theme. A color chip is shown by default; enable Colorize Call Tree category names (lana.callTree.categoryColorize) under preferences -> extensions -> Apex Log Analyzer to tint the whole cell instead. See Call Tree → Category Coloring.
Inspector
The inspector remembers where you dock it and how big it is:
lana.inspector.position- where it docks:right(default),leftorbottom.lana.inspector.size- its width (or height when docked to the bottom), in pixels.
Both update as you drag or re-dock the inspector, so you rarely need to edit them by hand.
Collapsed sections, their sizes and whether the inspector is open are remembered too, but aren't settings you edit.